Introducing the Energy Dashboard
Thinka Team ·

We are pleased to introduce the Energy Dashboard: a new page in Thinka that shows where the electricity in your home goes, what it costs, and what is drawing power right now.
It is built on what your home already measures. Every KNX or Z-Wave accessory that reports power or energy feeds the dashboard automatically, and a P1 smart meter adds the whole-house picture. Every figure is read from the history database on your Thinka itself — nothing leaves your home.
Where the energy went
The flow view follows the electricity from the grid through each room to the individual device. Switch between the flow, a breakdown by room and a breakdown by device, and click a room to open it. Devices that are not assigned to a room show up as an untracked share — assign them and the share shrinks.
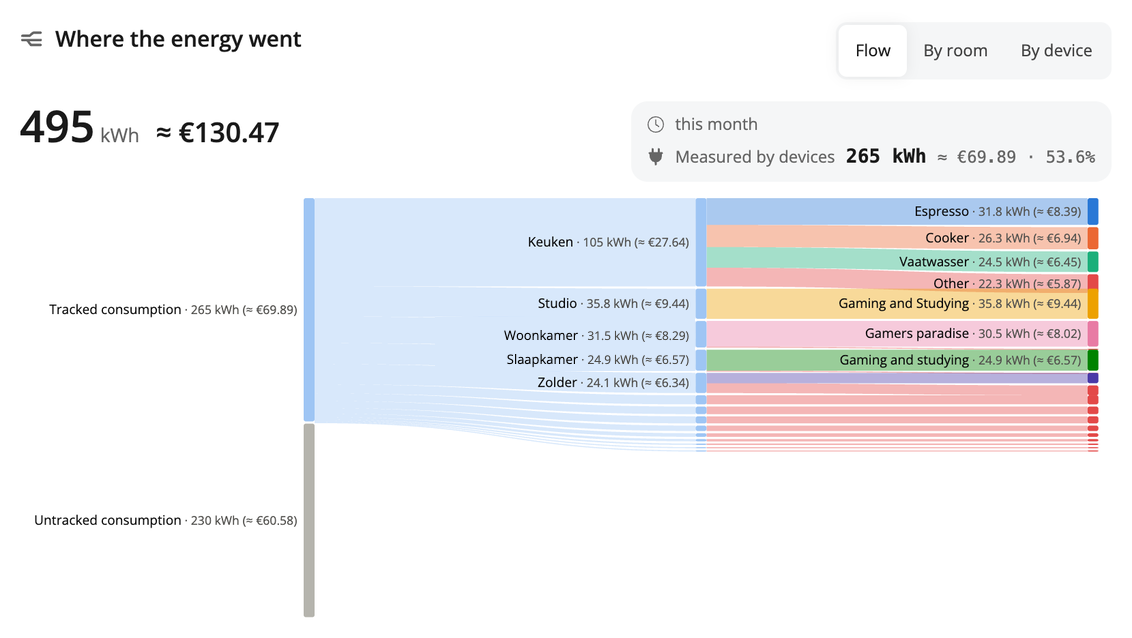
The flow view: from the grid, through the rooms, to the device.
Electricity and gas
Consumption per hour, day, week or month, split into peak and off-peak. Click a bar to zoom into that period. If your meter reports a single tariff, every bucket simply counts the same. With a P1 meter connected, gas gets its own chart alongside electricity, and feed-in from solar panels or a battery is shown as well.
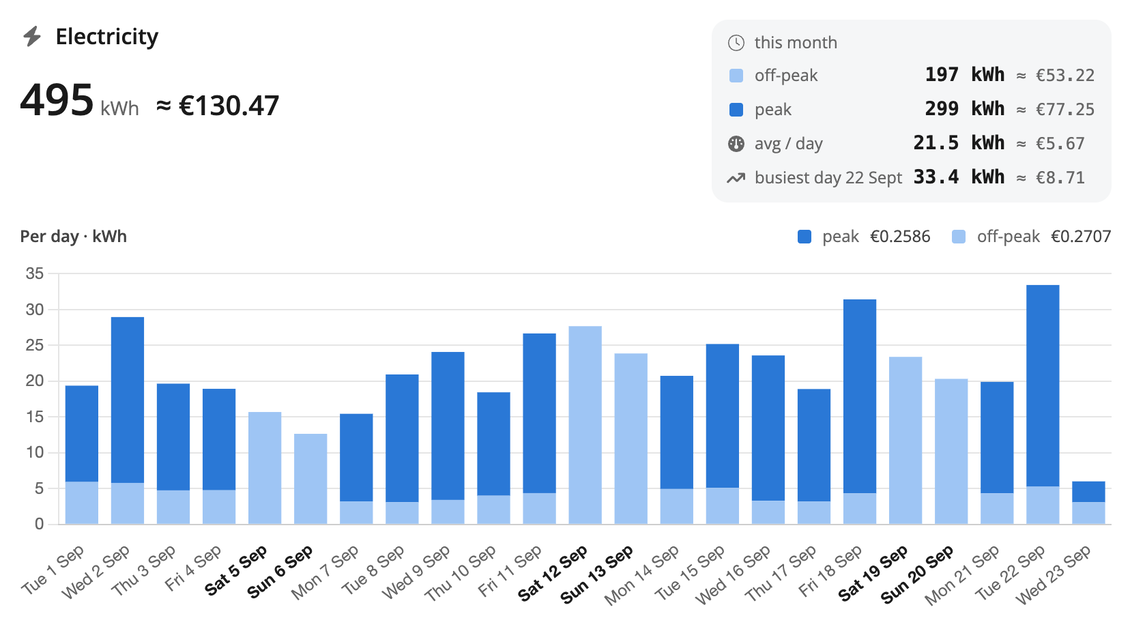
One period drives every card, from today to this year, so the flow, the charts and the cost totals always agree.
Estimated costs
Enter the rates from your energy contract and see what a day, a month or a year cost — including gas, feed-in credit and fixed charges. Until you enter your own rates, average market rates are used, and changing them takes effect immediately. It is an estimate, not a bill, but it is your estimate, at your rates.
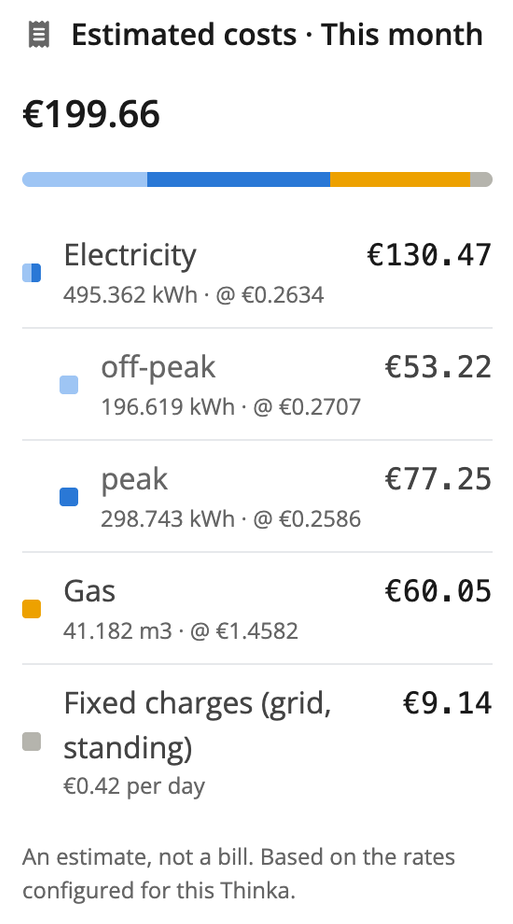
Estimated costs for the chosen period, at the rates you entered.
Biggest consumers, right now
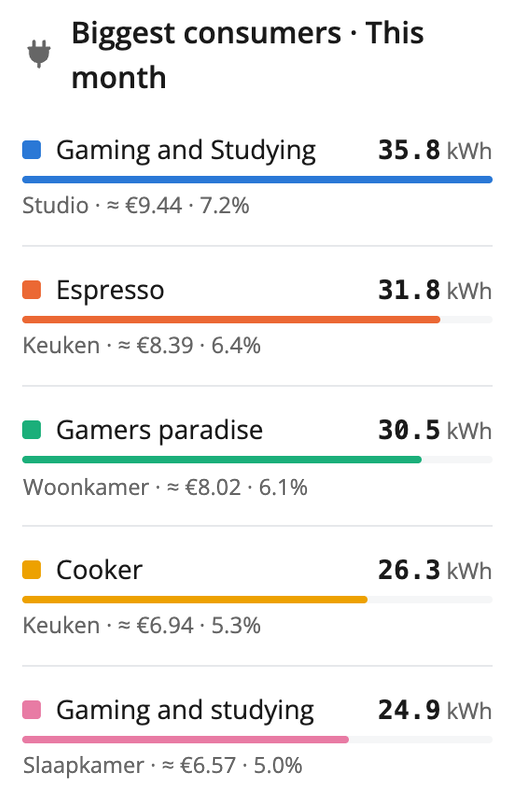
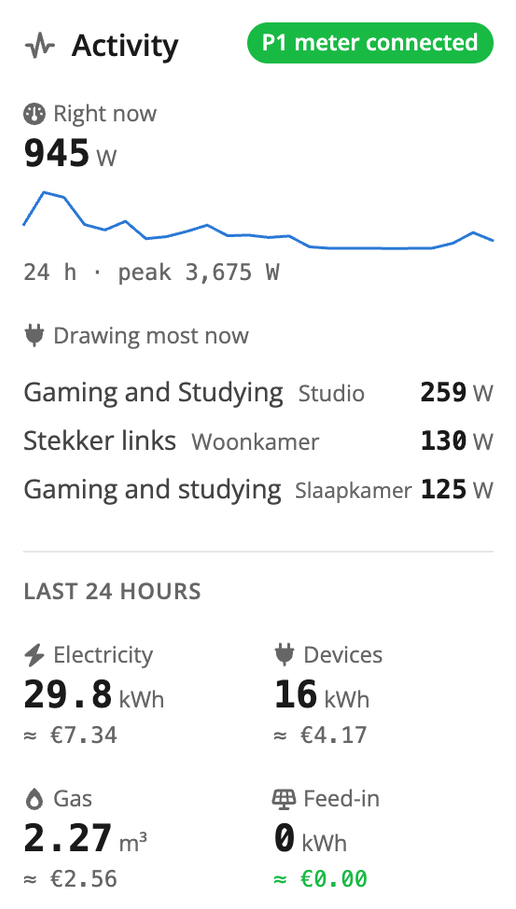
The dashboard lists the devices that used the most in the chosen period, and what is drawing power at this very moment, in watts. The activity card keeps an eye on the live picture: the current draw, the last 24 hours, and — with a meter connected — whether you are feeding back into the grid right now.
How it works
Your devices. Metering sockets, actuators and dimmers that report power or energy, on KNX or Z-Wave, appear on the dashboard without any configuration. Assign them to rooms and the flow view fills itself in.
A P1 smart meter. Any smart meter with a P1 port (DSMR) can be connected to your Thinka, by cable or over the network, for the whole house's electricity, gas and feed-in. The dashboard then shows how much of the total your devices account for. Connecting a meter is a Thinka Pro feature.
Your rates. Fill in the rates from your energy contract on the dashboard itself. Until you do, average market rates are used.
How to get it
The Energy Dashboard is part of the latest Thinka beta software update. Open Settings on your Thinka, press Update, and find Energy in the menu. The dashboard is on by default; if you prefer not to see it, you can hide it under Settings — the figures keep being recorded, so nothing is lost when you bring it back. Later this week available on the stable channel. You will need a recent Thinka model, that has enough memory to run a database. You will recognize that it has a History tab under Settings.
We look forward to hearing what your home reveals.